While modern finite element analysis dominates practice, the logic of graphical statics underpins structural engineering intuition, making it a foundational skill for the well-rounded engineer.
Structural engineering often seeks clarity in the relationship between forces and form. Before computers, engineers developed methods that allowed visual exploration of this relationship without lengthy calculations. One such method, graphical statics, emerged as a powerful tool for understanding how loads travel through a structure. Its foundation lies in geometry rather than algebra. It represents forces as lines to scale and shapes as diagrams that reveal equilibrium.
Graphical statics was developed in the 19th century to support the design of bridges, roofs, towers, and other large structures. It allowed engineers to determine reactions, internal member forces, and load paths with precision using only straightedges, compasses, and drawing boards. For decades, it served as the primary design method for trusses, arches, and cable-supported systems. Even as mathematics and computational tools advanced, graphical statics retained relevance for conceptual clarity.
Today, it remains valuable for education and for initial design studies. The method offers insight that numerical results alone cannot match. The visual approach highlights relationships between geometry and load distribution in a way that promotes intuitive understanding of structural behaviour. While modern finite element analysis dominates practice, the logic of graphical statics underpins structural engineering intuition, making it a foundational skill for the well-rounded engineer.
Principles of Graphical Statics
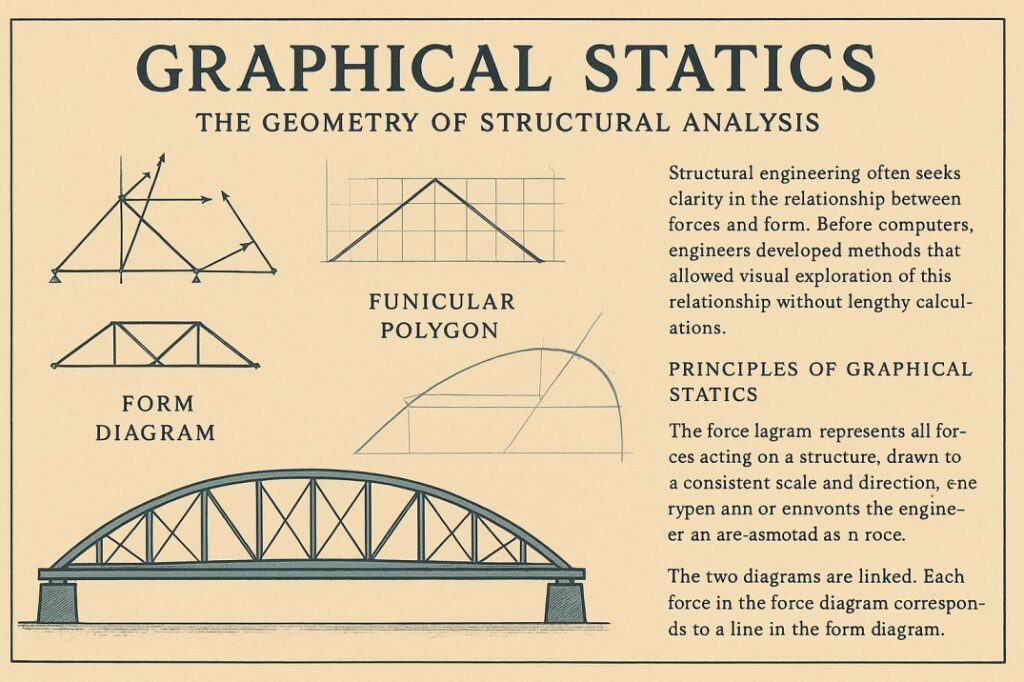
Graphical statics rests on two main constructs: the force diagram and the form diagram (Figure 1). The force diagram represents all forces acting on a structure, drawn to a consistent scale and direction. The form diagram represents the actual geometry of the structure and the direction of its members. The two diagrams are linked. Each force in the force diagram corresponds to a line in the form diagram, and each line in the form diagram corresponds to a force in the force diagram.
The relationship between these diagrams follows from the principles of static equilibrium. A body in equilibrium must have the vector sum of its forces equal to zero. By arranging forces head-to-tail in a closed polygon, the engineer can ensure that equilibrium exists. This geometric approach replaces algebraic resolution with proportional measurement. Forces are measured as line lengths, and their directions are given by the orientation of the lines.
Maxwell and Cremona developed systematic ways to construct these diagrams. Maxwell introduced the reciprocal relationship between form and force diagrams. Cremona refined the graphical method for determining member forces in pin-jointed trusses. Together, their contributions formed the basis of practical graphical statics used by engineers worldwide in the late 19th and early 20th centuries.
Application to Trusses
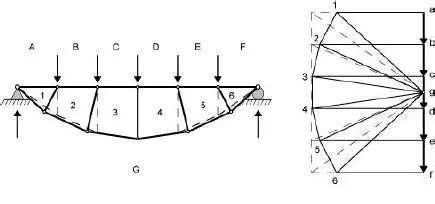
Pin-jointed trusses are especially well suited to analysis by graphical statics. Each joint acts as a point in equilibrium under the action of member forces and external loads (Figure 2). By isolating a joint and arranging its forces in a force polygon, the magnitude and direction of unknown forces can be determined.
The process begins with known loads and support reactions, both determined graphically or through basic statics. These forces are drawn to scale in a force diagram. Each joint in the truss is then analysed in turn. Known forces are plotted, and unknown member forces are determined by completing the polygon of forces for that joint. Tension and compression are distinguished by the direction in which the force line acts relative to the joint.
This method is particularly powerful for large trusses. Instead of solving many simultaneous equations, the engineer uses proportional construction to determine forces. Accuracy depends on drawing precision and scale, but the logic is transparent. Any error in force closure is immediately visible as a gap in the polygon, prompting review.
Arches and Cable Structures
Graphical statics also serves curved structures, such as arches and cable systems. For these, the funicular polygon becomes central. The funicular polygon represents the line of thrust within the structure. It is constructed by applying loads to a reference line and finding the path of internal forces that balance them.
In arches, the thrust line must remain within the middle third of the section to avoid tension. By adjusting the geometry or loading, the engineer can keep the thrust line within limits. Graphical statics allows this to be seen directly. The form diagram shows the actual arch geometry, while the force diagram shows the distribution of horizontal thrust and vertical forces.
Cables and suspension systems are analysed in a similar way. The cable takes the shape of the funicular polygon for the applied loads. By reversing the diagram, the engineer can find the shape that produces uniform tension under given loading. This method influenced the design of suspension bridges and roof systems before analytical expressions for catenary and parabolic forms were widely used.
Historical Significance
During the late 19th century, graphical statics was the dominant method for structural analysis in large engineering projects. It was taught in technical schools and applied in bridge companies, railway workshops, and architectural offices. The Eiffel Tower, Garabit Viaduct, and Forth Bridge all benefited from methods rooted in graphical analysis.
Gustave Eiffel’s work demonstrates the method’s power. For the Eiffel Tower, wind load analysis relied on graphical resolution of forces through its truss-like lattices. The Garabit Viaduct’s parabolic arch was also designed using thrust line diagrams to maintain compression. In Scotland, the Forth Bridge’s massive cantilevers were checked with force polygons to ensure member sizing matched load paths.
These projects were not mere artistic feats as they seem today. They were engineering achievements made possible by clear visual reasoning. Graphical statics provided the means to understand complex load paths without computational requirement. The accuracy achieved by skilled engineers rivalled that of early numerical methods.
Strengths of the Method
Graphical statics offers several enduring advantages in structural work. It produces immediate visual feedback about force flow. It integrates geometry directly into the analytical process, which reinforces the link between form and structural behaviour. Also, It is adaptable to multiple structural types, from trusses to curved shells.
One of its greatest strengths lies in error detection. In algebraic methods, numerical errors can remain hidden until late in the process. In graphical statics, a failure of a polygon to close reveals an error immediately. This makes the method inherently self-checking, promoting careful thinking.
The method also supports design iteration. By simply adjusting a member position or a load in the form diagram, the corresponding force changes in the force diagram without recalculating equations. This promotes experimentation, allowing rapid testing of alternative forms in the early stages of design.
Limitations in Modern Context
Despite its strengths, graphical statics has limitations. It requires physical space for drawing and high drafting skill to maintain accuracy. Scaling errors can accumulate in large or complex structures. The method becomes less efficient when dealing with many load cases or with distributed loads that vary significantly.
It also operates under the assumption of linear elastic behaviour and static equilibrium. Nonlinear effects, dynamic loading, and three-dimensional complexity cannot be captured easily. These limitations explain why modern practice uses finite element analysis for most detailed design work.
However, these limitations do not remove the value of graphical statics. In concept development, its speed and clarity often surpass computational design approaches. It strips away unnecessary complexity, allowing engineers to focus on fundamentals before committing to a digital model.
Revival Through Digital Tools
In recent years, computational design platforms have revived interest in graphical statics. Programs can now generate reciprocal force and form diagrams in real time. These tools combine the conceptual clarity of the classical method with the speed of modern computation.
Digital graphical statics allows rapid iteration. Changes to loads or geometry update diagrams instantly. Precision is no longer limited by manual drafting. Three-dimensional versions extend the method’s reach to spatial frames and complex geometries once inaccessible to hand methods.
The continued relevance of graphical statics in the digital era confirms its foundational role. Far from being obsolete, it evolves alongside technology, offering a geometric perspective that complements numerical simulation.
Conclusion
Graphical statics is more than a historical curiosity. It is a method that links force and form through geometry, offering insights that remain valuable in both education and practice. Its principles deeply rooted in the ideology of force polygons, reciprocal diagrams, and funicular forms provides a clear window into structural behaviour.
While finite element analysis now dominates detailed design, the conceptual clarity and error visibility of graphical statics still hold something of value. It shaped some of the world’s most celebrated structures without relying on modern computation. Its lessons in equilibrium, proportion, and load paths remain relevant for the well-rounded engineer.
The method endures because it teaches more than calculation—it teaches understanding.
Also See: Modelling Structures for Static Linear Analysis
Sources & Citations
- Maxwell, J.C. (1864). On Reciprocal Figures and Diagrams of Forces. Philosophical Magazine.
- Cremona, L. (1890). Graphical Statics. Oxford University Press.
- Block, P., et al. (2014). Graphic Statics in Structural Design. International Journal of Space Structures.
- Huerta, S. (2004). Structural Design in the Work of Gaudí. Architectural Science Review.
- The Geometry of Equilibrium: James Clerk Maxwell and 21st-Century Structural Mechanics, edited by William F. Baker and Allan McRobie (Cambridge University Press, 2025)